Your Backtest Is Lying About Costs
Graveyard of Good Ideas #7 — This one didn't die. For once, the numbers held up under pressure. We're as surprised as you are.
Your backtest says PF 3.0. Your live account says PF 1.2. You've checked the code three times. The logic is identical. What happened?
If you've ever run an MQL backtest on MetaTrader and watched it produce beautiful equity curves that collapse the moment you go live, you already know the answer — you just might not know where the money is leaking.
We spent the last few weeks systematically hunting for every source of divergence between our backtests and live execution. We tested seven assets across five different cost scenarios. The results were... not what we expected.
The Three Suspects
Everyone who's been in quant trading long enough has the same list of usual suspects when backtests diverge from reality:
Entry price. Your backtest uses the bar's close price. You enter at close, right? Except you don't. You see the close, compute your signal, send the order, wait for a fill. By then you're somewhere between the close and the next bar's open. For a 15-minute strategy, that's potentially seconds to minutes of drift.
SL/TP bar conflict. What happens when both your stop loss and take profit get hit within the same bar? Most backtesting engines check SL first. Always. So in your backtest, when price spikes through your TP then reverses to hit your SL (all within 15 minutes), you book a loss. In reality? You might have been filled at TP. Or not. Nobody knows without tick data.
Cost modeling. This is the big one. Almost every backtest we've seen — MQL, Python, TradingView Pine Script — uses a flat cost per trade. "Spread is 2 pips, commission is $7 round trip, done." Sounds reasonable. It's wrong.
What We Actually Tested
We built a simulation framework with toggleable "realism knobs" and ran every combination across all our assets:
- A) Baseline — current backtest (close-price entry, flat 8bp round-trip cost, SL-priority on conflicts)
- B) Next-bar open entry — signal fires on bar N, enter at bar N+1's open price
- C) Pessimistic SL/TP — when both hit in the same bar, estimate which came first using Open-High/Open-Low distance, plus 2bp extra slippage on stop fills
- D) Asymmetric costs — different cost per exit type (limit exits are cheap, stop exits are expensive)
- E) Everything combined
Entry Price: The Dog That Didn't Bark
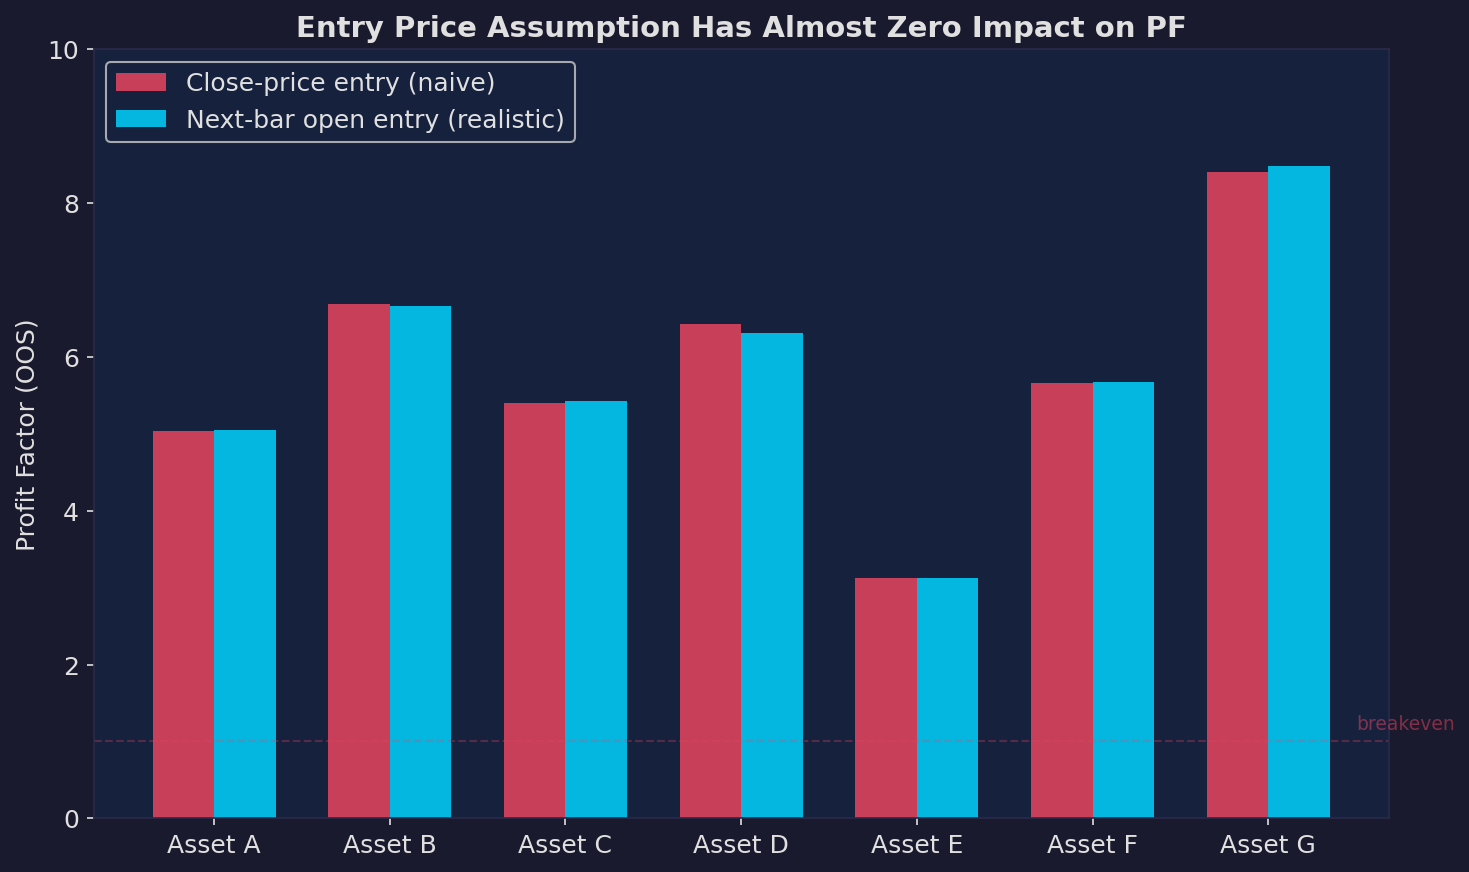
We were sure this would matter. Moving from close-price entry to next-bar open should degrade performance, because you're giving up the "I can see the future" advantage of knowing the close before you trade at it.
It didn't. Across all seven assets, the PF change was between -0.11 and +0.08. Essentially noise.
This is actually great news, and here's why: if your PF drops significantly when you switch from close to next-open entry, your "edge" was partly an artifact of entering at a price you can't actually get in real trading. Our signals work because the direction is right, not because we need millisecond-perfect execution. That's the kind of edge that survives contact with reality.
If you're building a strategy and this test tanks your performance... maybe that's information you want before you fund the account.
SL/TP Conflicts: Also Irrelevant (For Us)
The pessimistic SL/TP handling barely moved the needle either. PF changes of -0.04 to 0.00 across the board.
Why? Because of how our strategies exit.
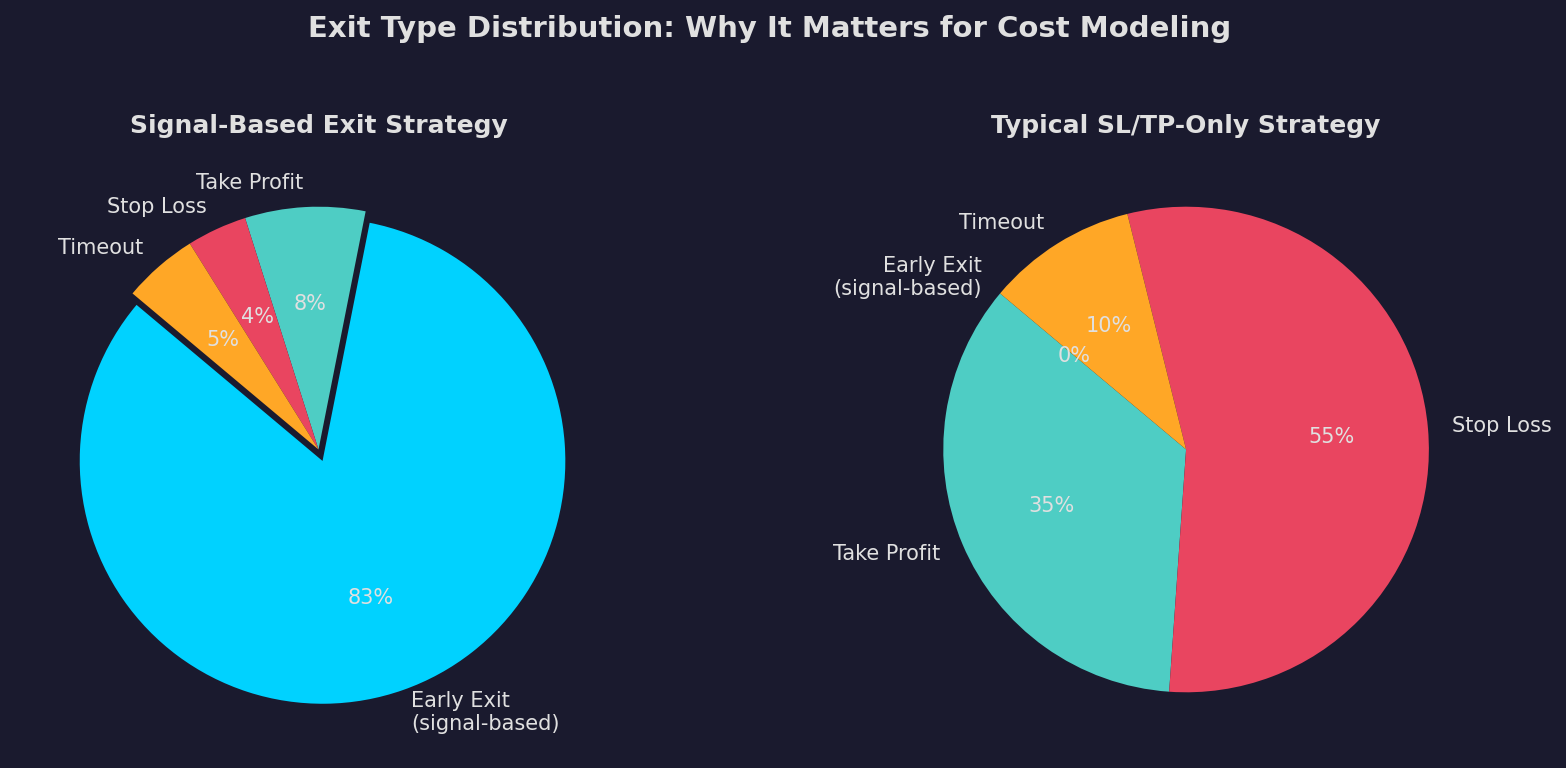
The left pie is our actual exit distribution. Over 80% of our exits are signal-based — the system detects a regime change and gets out before price has a chance to hit SL or TP. Stop losses account for 2-5% of exits. Take profits, 5-12%.
The right pie is what a typical MQL strategy looks like: enter on some indicator cross, set a fixed SL and TP, and wait. 55% stop losses, 35% take profits, no signal-based exits at all.
If you're in the right pie, SL/TP bar conflict handling matters a lot. If you're in the left pie, it's rounding error.
This raises an uncomfortable question for the MQL crowd: if more than half your exits are stop losses, is your entry signal actually predicting anything? Or are you just rolling dice with asymmetric payoffs?
The Cost Asymmetry Nobody Talks About
Here's where it gets interesting.
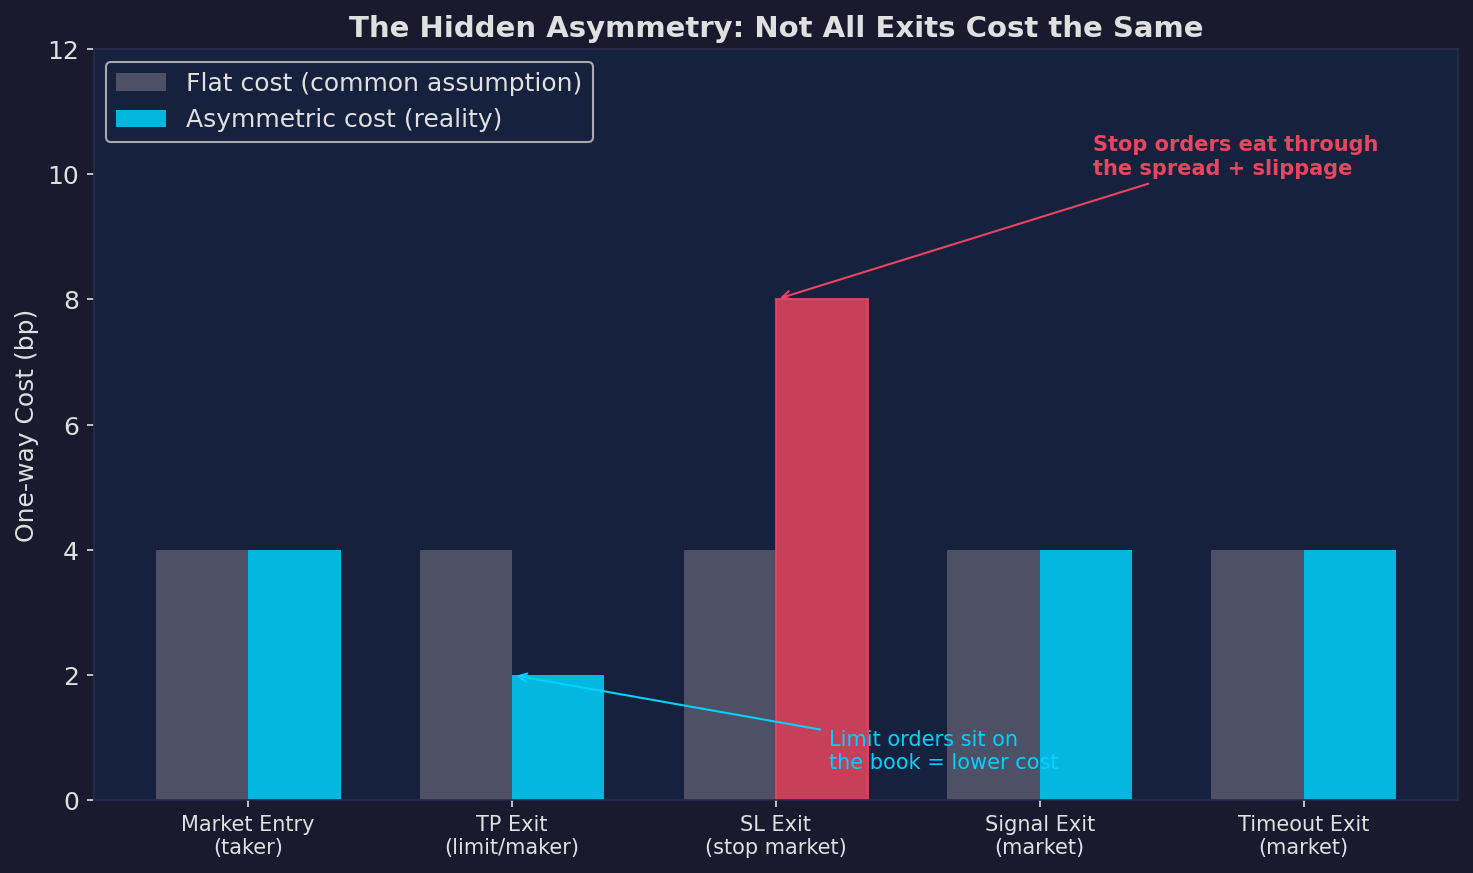
A flat cost-per-trade assumption treats all exits equally. But they're not:
- Take profit exits are limit orders. They sit on the book waiting to be filled. They provide liquidity. You get filled at your price or better. Cost: low.
- Stop loss exits are stop-market orders. When triggered, they become market orders that take liquidity. In a fast-moving market (which is exactly when stops get hit), spreads widen. Cost: high.
- Signal-based exits are market orders sent at a scheduled time. Normal spread, normal fill. Cost: medium.
So what does this mean for round-trip costs?
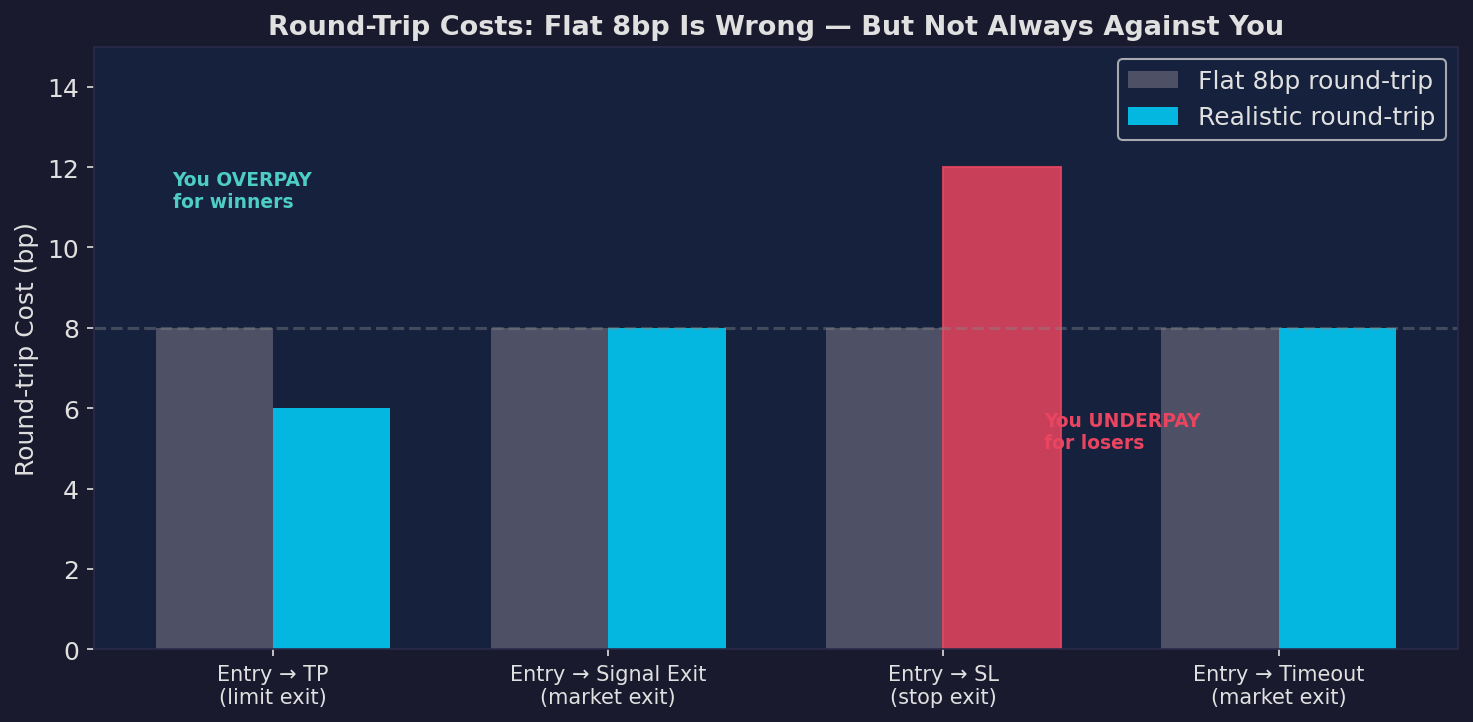
A flat 8bp assumption overpays for winning trades (TP exits cost ~6bp round trip in reality) and underpays for losing trades (SL exits cost ~10-12bp round trip). These errors partially cancel out, but the net effect depends entirely on your exit distribution.
For our strategies where signal-based exits dominate (8bp round trip, same as the flat assumption), the flat cost model is accidentally accurate. The errors on TP and SL exits are small because those exits are rare.
For a strategy where 55% of exits are stop losses? Flat 8bp is dangerously optimistic. You should be modeling 10-12bp for those exits, and your "PF 2.0" might really be PF 1.4.
What This Means If You're Using MQL/Pine Script
If you're generating strategies with ChatGPT or Claude and backtesting them in MetaTrader, here's what's probably happening:
- Your backtest uses "every tick" or "1-minute OHLC" mode, which sounds realistic but still doesn't model cost asymmetry
- You set spread to 2 pips and commission to $7 and call it done
- Your strategy exits primarily via SL/TP (because the AI generated a simple indicator cross + fixed SL/TP setup)
- Your backtest PF of 1.8 is really closer to 1.3 after accounting for the fact that 55% of your fills are stop orders eating wider spreads
The fix isn't to switch to tick data backtesting. That's overkill for anything above 5-minute timeframes and the data is expensive. The fix is:
Model your costs by exit type. It takes maybe 20 lines of code. Give limit exits a lower cost. Give stop exits a higher cost. See what happens to your equity curve.
If your strategy survives that test? Good. You probably have something real.
If it doesn't... well, better to find out in a spreadsheet than in your brokerage account.
Our Numbers After All Improvements
We applied every realism improvement simultaneously — next-bar open entry, pessimistic SL/TP handling, asymmetric costs, extra stop slippage — and compared to our baseline:
The PF moved less than 3% in either direction for every single asset.
We're not going to pretend we expected that. We went into this assuming we'd find at least one asset where the "real" PF was meaningfully lower than the backtest PF. We didn't. The edge is in the signal quality, not in backtest flattery.
That said, we're not declaring victory yet. Backtests can only tell you so much. We're running paper trades on everything right now, and in a few weeks we'll have real fill data to compare against. That's the test that actually matters.
This is not investment advice. Past results don't guarantee future performance. All analysis reflects our internal research process only.